Usage & Analytics
The Usage & Analytics section of the Tatum Nodes dashboard gives you a view of your activity across Tatum nodes. Use it to track consumption, detect anomalies, and export data for reporting.
Data defaults to the last 30 days and aggregates requests across every gateway under your account.
Usage Report
The Usage Report provides a detailed log of your activity. You can use it to:
- Review request counts per blockchain
- Identify usage spikes or drops over time
- Audit usage
- Export data for internal review
Via the Tatum Dashboard, The Usage & Analytics report can be directly accessed via Open in Looker Studio. This opens a pre-configured Google Looker Studio dashboard linked to Tatum Nodes data.
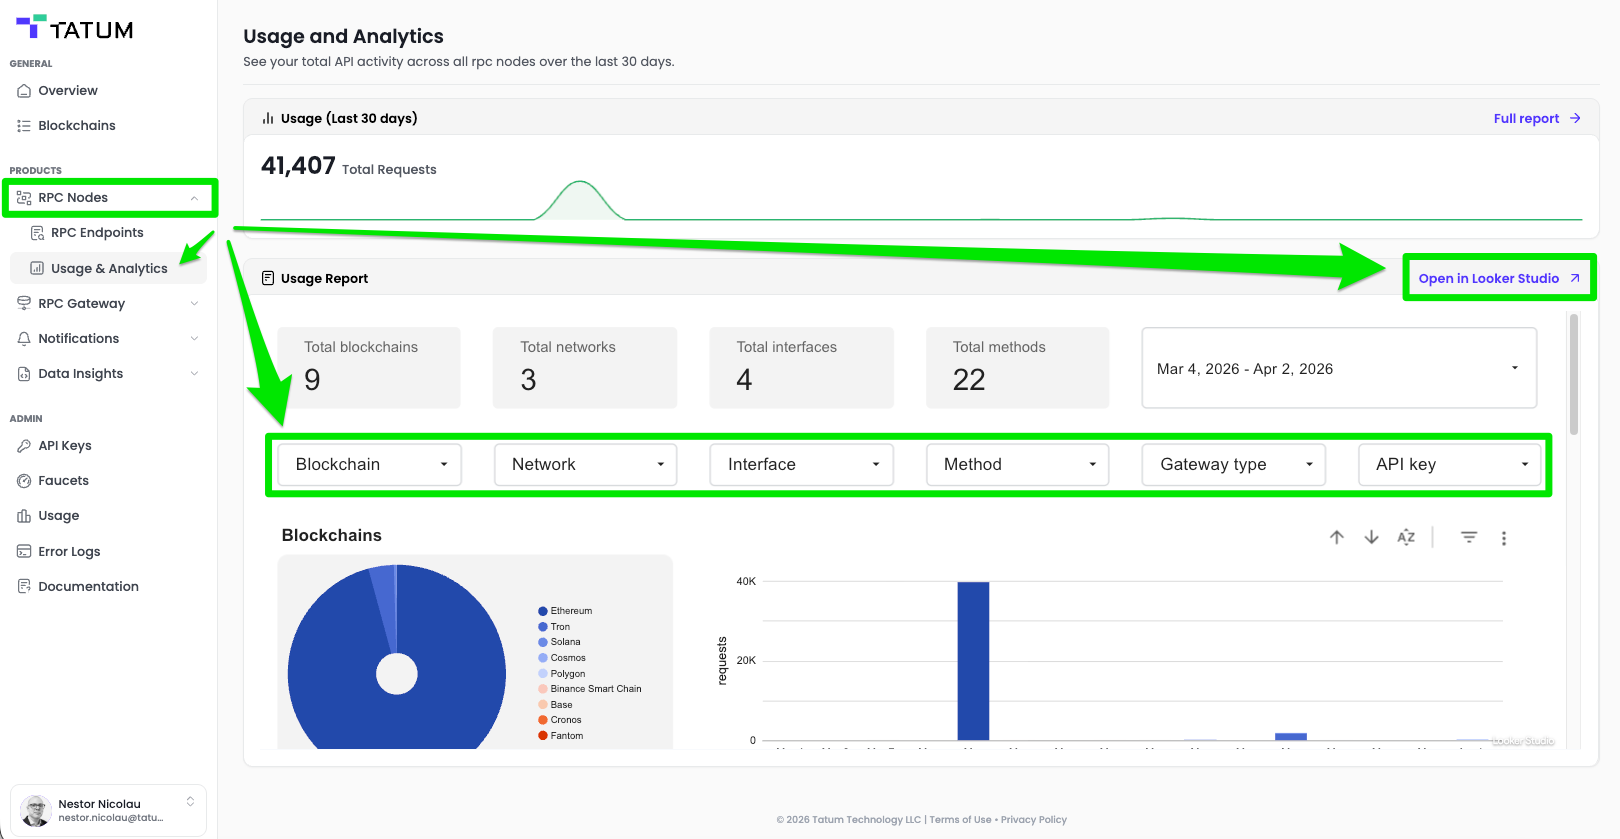
Tatum Dashboard > RPC Nodes > Usage & Analytics
NoteUsage data is updated periodically and may reflect a short delay of up to a few minutes from real-time activity.
Updated 4 months ago
Did this page help you?