Usage & Analytics
The Usage & Analytics section of the Tatum Gateway dashboard gives you a consolidated view of your activity across your gateways. Use it to track consumption, detect anomalies, and export data for reporting.
Data defaults to the last 30 days and aggregates requests across every gateway under your account.
Usage Report
The Usage Report provides a detailed log of your activity. You can use it to:
- Review request counts per gateway
- Identify usage spikes or drops over time
- Audit usage
- Export data for internal review
How to Retrieve the Gateway Usage
Get gateway usage
GET /v4/manage/gateway/{id}/usage
Retrieves usage for a specific gateway by its ID.
Get all usages
GET /v4/manage/gateway/usage
Retrieves global gateway usage for the authenticated user.
Via the Tatum Dashboard, The Usage & Analytics report can be directly accessed via Open in Looker Studio. This opens a pre-configured Google Looker Studio dashboard linked to your Tatum gateway data.
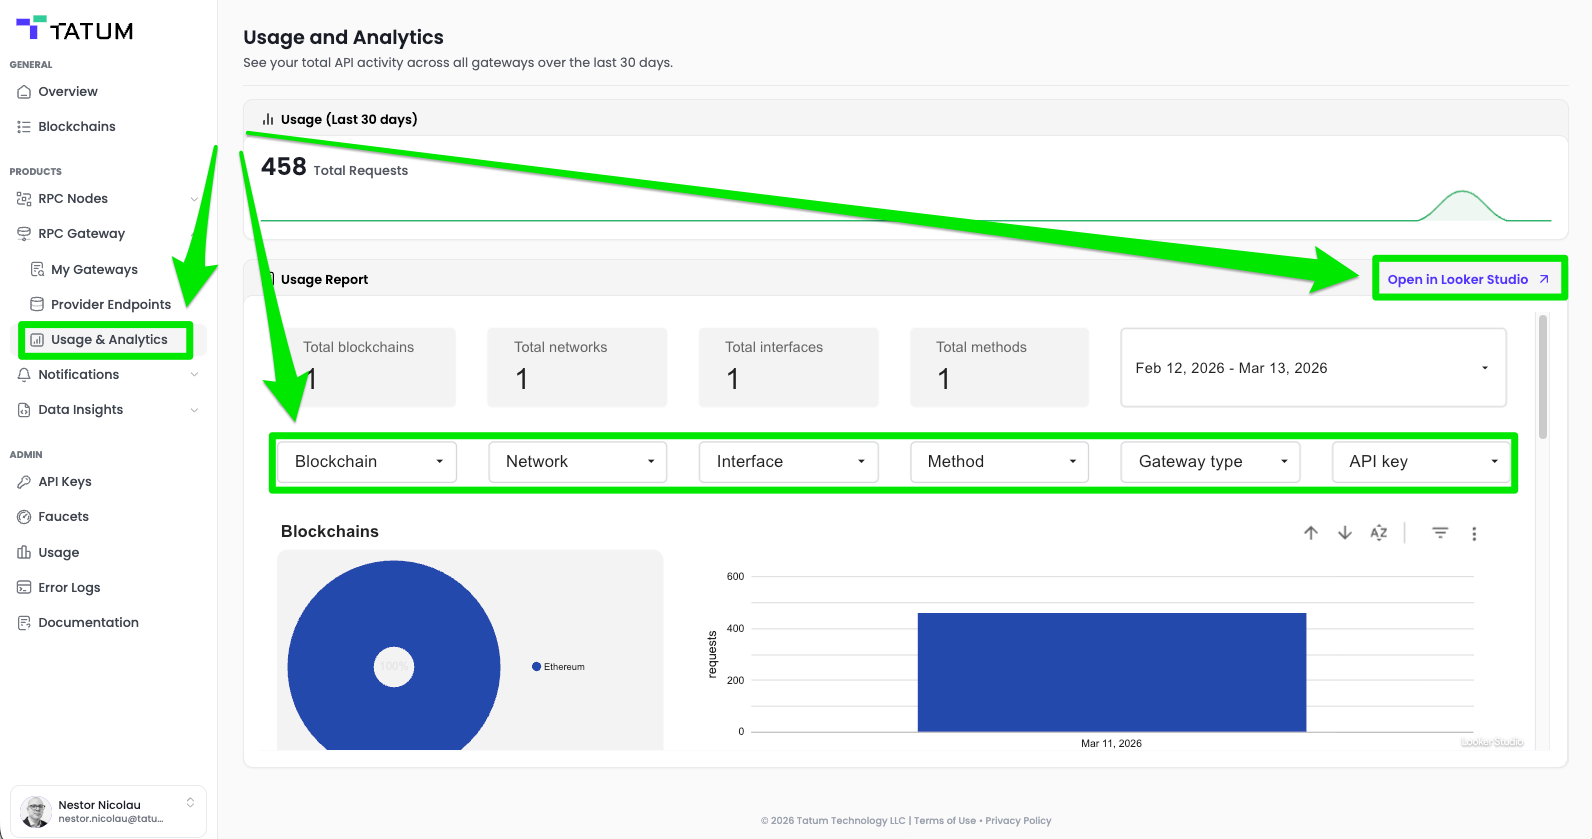
Tatum Dashboard - Usage & Analytics
Routing Report
The Routing Report provides a detailed log of each Gateway activity. You can use it to:
- Review request counts per provider endpoint
- Identify usage spikes or drops over time
- Audit usage against provider plan limits
- Export data for internal billing or cost-allocation workflows
- Clicking Open in Looker Studio opens a pre-configured Google Looker Studio dashboard linked to your Tatum gateway data.
Where to find it: Log in to your Tatum account → Navigate to [RPC Gateway] > [My gateways] > Select one of your gateways → Select [Routing Report]
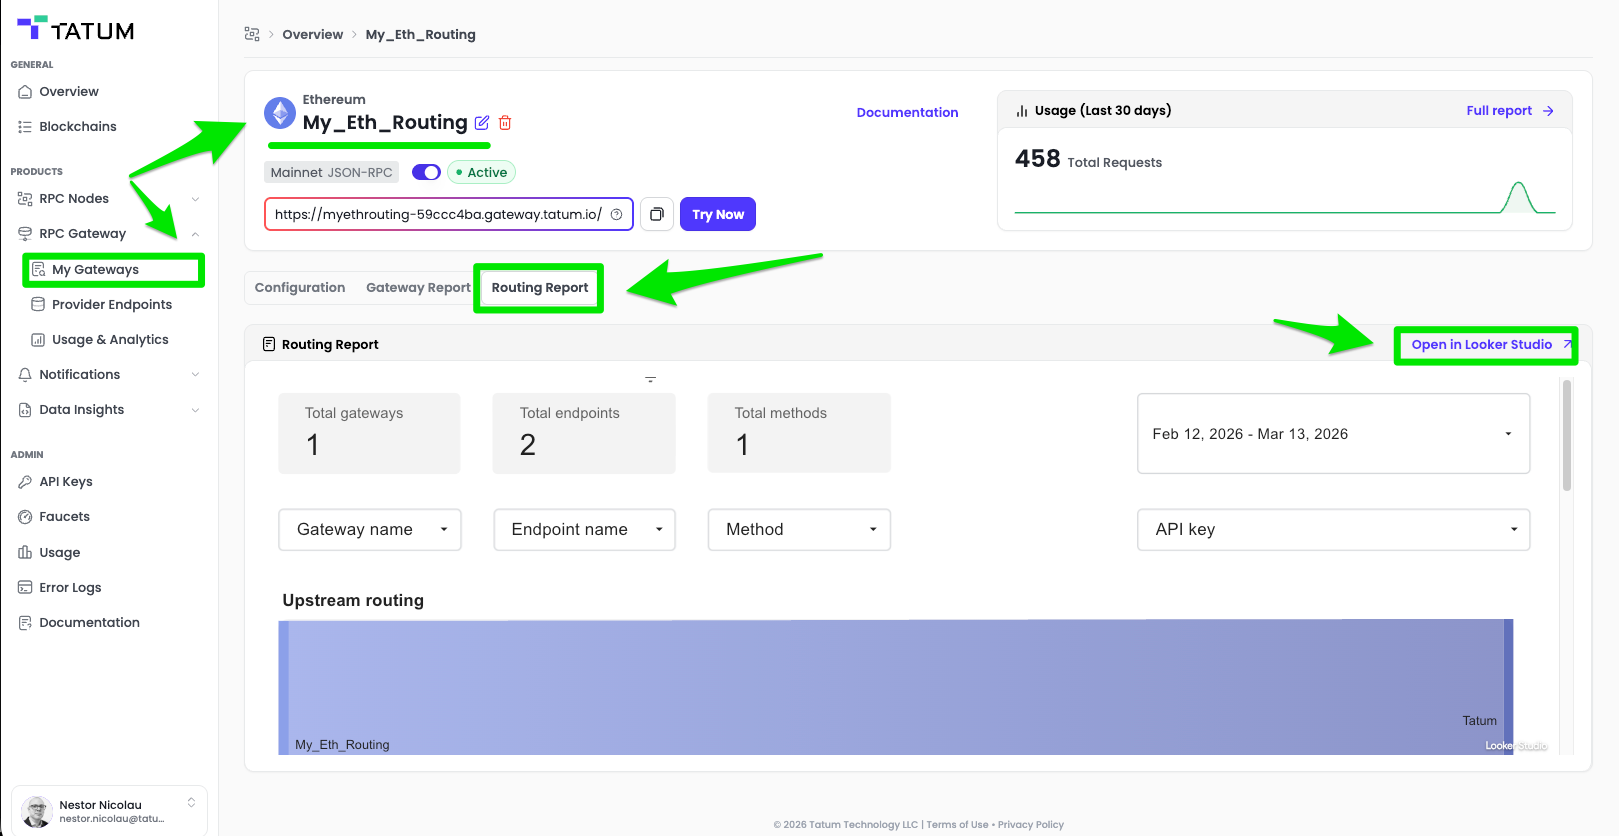
Tatum Dashboard - Routing Report
NoteUsage data is updated periodically and may reflect a short delay of up to a few minutes from real-time activity.
Updated 12 days ago