

Improved
Error Logs, Rebuilt
August 21st, 2026
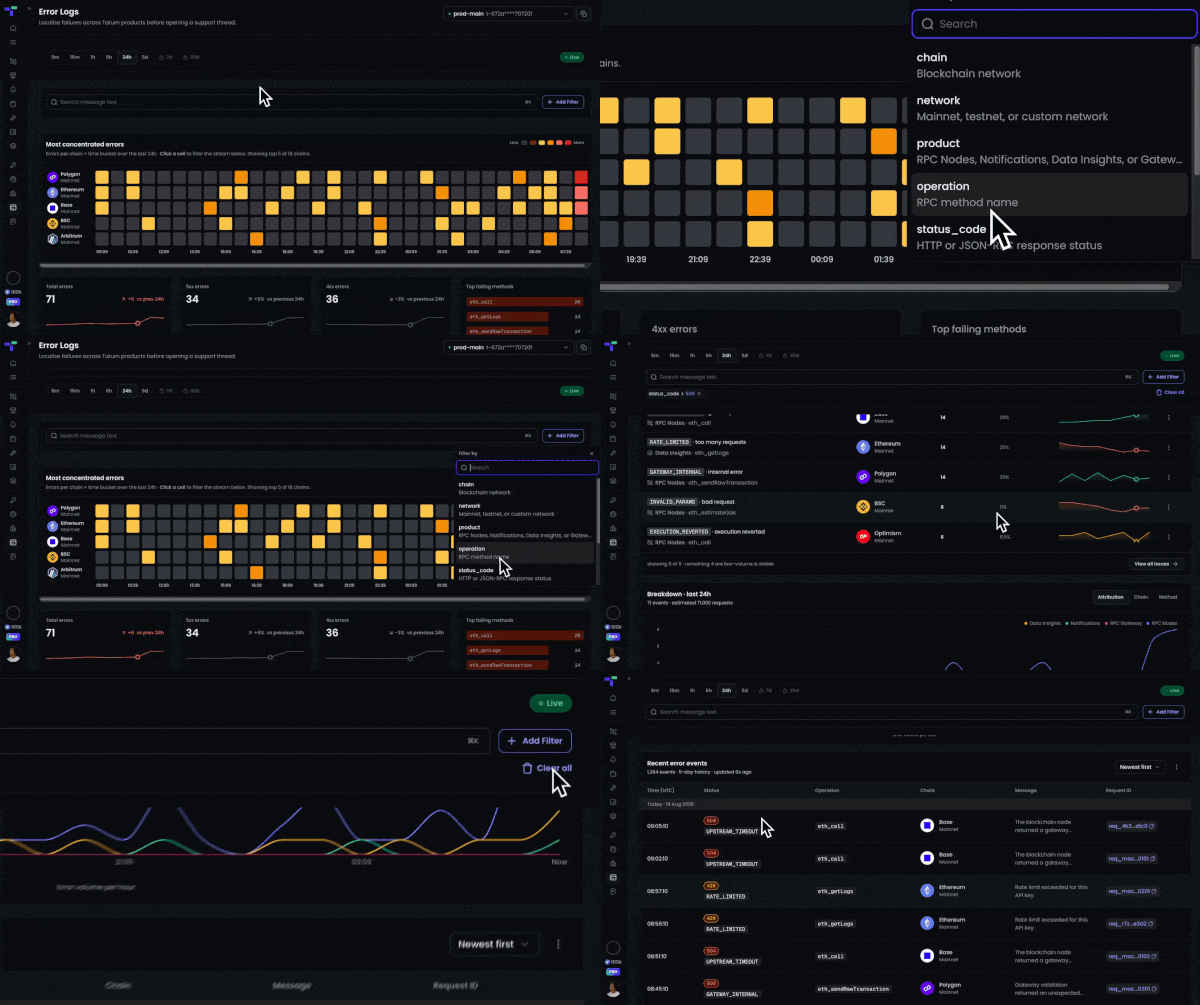
We have rebuilt Error Logs in the Tatum Dashboard to help you find and investigate API errors faster. The new view makes it easier to see where errors are happening, how often they occur, and which issues need attention.
What is new
- Error heatmap: See which networks and time periods have the most errors.
- Quick filtering: Click any hotspot or search by error message and request ID.
- Error metrics: Track total errors, 4xx, 5xx, and top failing operations.
- Issue grouping: See recurring errors grouped by fingerprint, including severity, share, and trend.
- Request details: Inspect the overview, payload, and raw data for each request.
Migration note: The legacy Error Logs will remain available until mid of September. The new Error Logs started collecting data from the release date, so older historical data will remain available only in the legacy section during this period.